Is It Down? Check a Website Response
Check whether a public domain returns an HTTPS response from a remote Globalping probe. This is a single root-path HEAD request with the actual response code and probe location. It helps answer “is it down from that location now?” but does not establish a worldwide outage or test every part of a website.
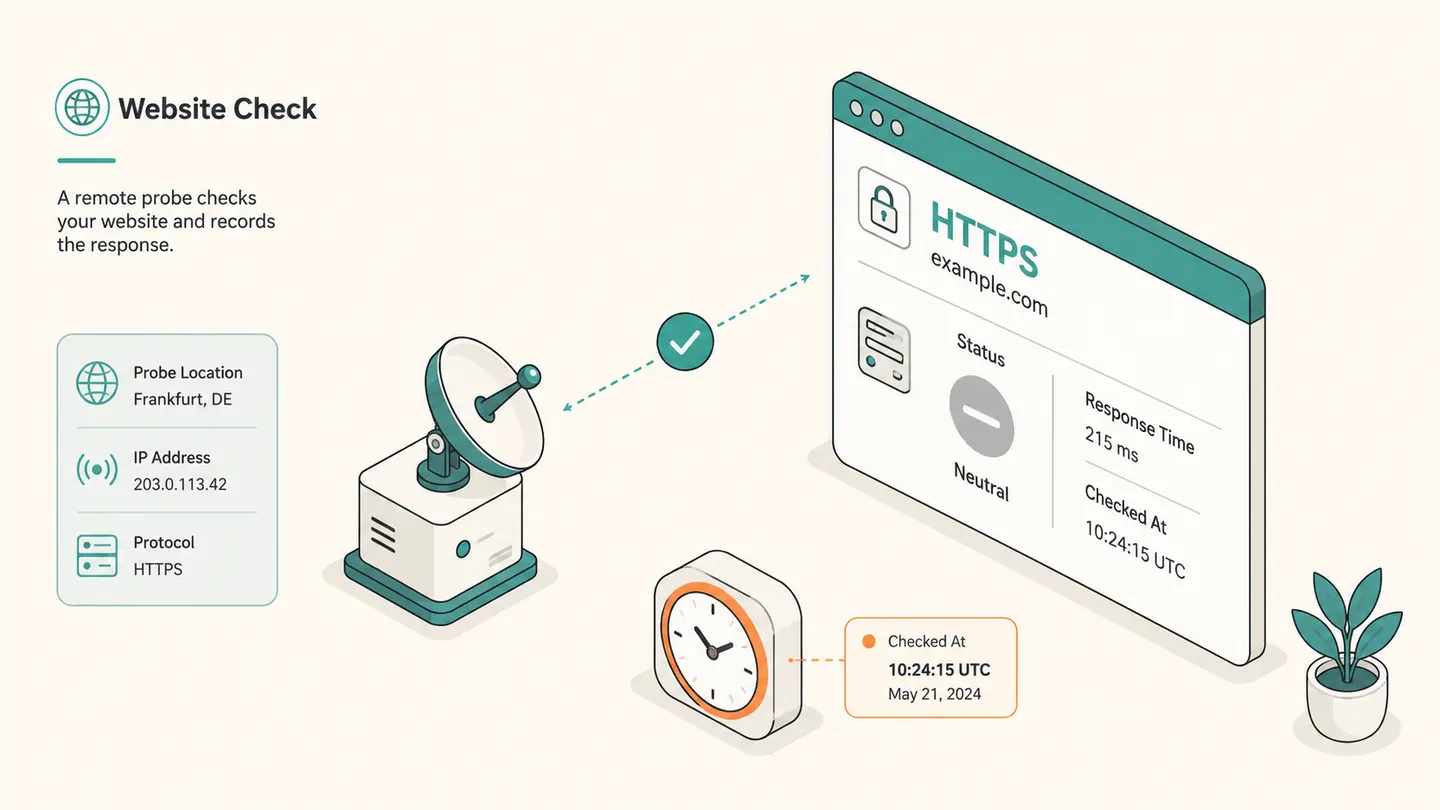
Check whether a public domain returns an HTTPS response from a remote Globalping probe. This is a single root-path HEAD request with the actual response code and probe location. It helps answer “is it down from that location now?” but does not establish a worldwide outage or test every part of a website.
HTTPS root path, HEAD request, one remote location. No login or continuous monitoring.
Best solution
Check whether a public domain returns an HTTPS response from a remote Globalping probe.
HTTPS root path, HEAD request, one remote location. No login or continuous monitoring.
No measurement yet. This checks from Globalping probes, not from your computer. No continuous monitoring.

Opens the Kepo download page; this calculation or file is not transferred.
Key solutions at a glance The main decisions from this guide, condensed into one table.
How to Use This Check
Enter the public domain you are authorized to check, without an account path, query string or private token. This tool checks the root of the host over HTTPS. If only a particular application page is failing, record that separately rather than assuming the root response describes the entire user workflow.
Choose a requested probe region, consent to the public measurement and start the check. The response identifies the actual probe. A website can behave differently by location, network, content-delivery edge or bot policy, so the origin of the request is part of the result.
Read the HTTP response code as an observation, not a single universal up-or-down label. A successful response differs from a redirect, a missing page, an access denial and a server error. A 403 response shows that something answered but refused the probe; it is not the same as no connection.
If the remote check responds but your browser still fails, compare the failing workflow with the tested root request. Your session, DNS cache, extensions or network route may differ. Avoid changing several settings at once. Keep one timestamped observation and the exact symptom so a later comparison remains meaningful.
What the Result Actually Means
The phrase is it down often combines several different questions: can a name resolve, can a connection open, does HTTPS negotiate, does a page respond, and does a logged-in application work? This component answers a narrow, observable part using an HTTPS HEAD request from a remote node. A HEAD response requests headers rather than the normal page body; some sites handle it differently from a visitor’s GET request. This limitation is shown explicitly. A failed probe can also reflect a provider problem or filtering, so failure alone does not justify declaring a global incident.
| Field or observation | Meaning |
|---|---|
| 2xx response | Root request received a success response |
| 3xx response | A redirect was returned |
| 4xx response | Request reached a service but was refused or unavailable |
| No response | Cause remains undetermined from this check alone |
Limits and Common Misreadings
This is a one-time check, not an uptime history. It does not schedule later requests, send alerts or calculate availability over a period. The existing website-monitor widget page describes a different, recurring workflow.
An application can return HTTP 200 while showing an error page or failing after login. Conversely, a remote probe can receive 403 while real users are admitted. Test the actual authorized user path before making a broader statement.
Do not publish “down for everyone” from one sample. If you need incident confirmation, combine observations with the service’s official status communication and your own authorized monitoring records.
An Example of Careful Interpretation: Separate the Observation from Its Cause
A probe receiving HTTP 403 has obtained an application-level response, even though access was denied. A probe timing out has not obtained that same evidence. Calling both results “website down” would erase an important distinction. If your own browser succeeds while the probe receives 403, a bot or network access policy is one possible explanation, not a confirmed cause. Check the service’s own access policy and authorized logs before deciding. Similarly, a root-path 200 response does not establish that checkout, search or account login succeeds.
Keep a Useful Troubleshooting Record
Keep the question, input, observation time and source together. A bare address, percentage or status code is difficult to interpret later because it omits the connection and measurement context. When comparing two observations, note what changed between them: the target, network, VPN state, selected adapter, record type or remote origin. Change one relevant condition at a time when possible. That makes the comparison easier to explain without inventing a cause from one number.
Save only information you actually need. Network records can reveal infrastructure names and connection details, even when they do not contain a password. Remove unrelated identifiers before sharing a screenshot with another person. Never put private credentials in a domain field or publish an internal hostname as part of a public test. A copied result is a snapshot, not a promise that the same conditions still apply when someone reads it later.
Kepo is a Mac desktop-widget product for repeated checks and small workflows. A labeled troubleshooting note or a supported monitoring widget can keep the relevant context accessible while you work. The download link opens the product workflow; this article does not automatically install a configured diagnostic widget, transfer your network inputs or start a scheduled check. Confirm the actual widget’s capabilities before relying on it for ongoing observations.
Choose the next task by the question you need answered.
Frequently Asked Questions
Does is it down? check a website response describe my entire network?
No. The steps and component above define the scope of this observation. A local adapter value, an external address and a remote probe result describe different viewpoints. Preserve that context and do not generalize a single observation to every application or connection.
What should I do when a result is unavailable?
Keep it marked unavailable. An unfinished or failed observation is not a successful zero result and does not establish the cause of a problem. Check the input and try again later only when another observation is useful. Respect provider limits rather than repeatedly retrying.
Does this page save a monitoring history or install a desktop widget?
No. The page provides the specific manual workflow described above. It does not schedule future tests or create a configured desktop widget. Save the relevant result yourself and use an explicitly supported monitoring feature if you need recurring checks.
Sources and Method
Primary references for the protocol, provider or operating-system steps.
A useful network answer states what was checked, where the observation came from and what remains unknown. Keep those distinctions when you save or share the result.
Stay informed with Kepo on your desktop
Embed interactive widgets, monitor dynamic sites, track APIs, and run ambient AI agents right on your macOS desktop.
Related Articles
View all posts →Ping Test from a Remote Probe
Run a small ICMP ping test from a Globalping probe to a public domain you have permission to test. The tool sends five packets and shows returned round-trip statistics and the actual probe location. It does not send ICMP packets from your browser or measure the first Wi-Fi hop from your computer.
Packet Loss Test: A Remote ICMP Sample
Run a 16-packet ICMP sample from a named remote probe and inspect the sent, received and lost packet counts. This packet loss test describes the selected remote path during that short sample. It is not a browser-to-game-server test or a continuous measurement of your Wi-Fi connection.
TCP Port Checker
Check one TCP port on an authorized public domain from a remote Globalping probe. The port checker reports whether TCP responses were observed and retains packet statistics. A missing response is not proof that a port is closed, and this tool does not scan a range of ports or inspect your private local network.
SSL Checker: Inspect a TLS Certificate
Inspect TLS information returned by an HTTPS request from a remote probe, including the certificate subject, issuer, validity dates and probe trust result when available. This SSL checker checks the public domain’s root endpoint. It is not an exhaustive certificate-chain, cipher-suite or browser-compatibility audit.